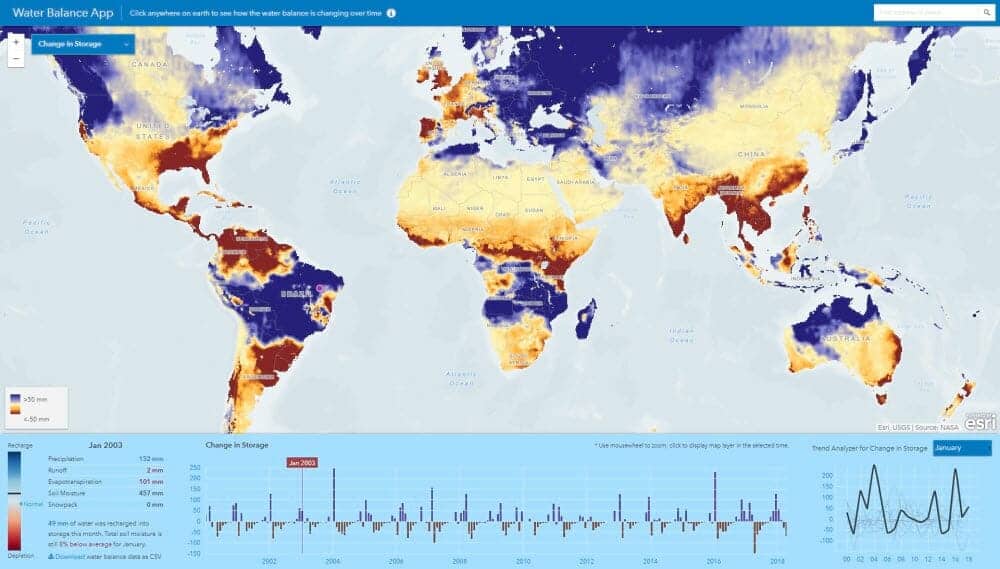
A new image service has been added to the Living Atlas of the World. It shows monthly change in water storage, as derived from NASA’s GLDAS dataset.
Change in storage is calculated by subtracting the water output (runoff and evaporation) from water input (rainfall). Where the input is higher than the output, this means water is being stored in the landscape. Where output is higher than the input, storage is being depleted.
This image service is time-enabled, allowing you to move through the seasons, month by month, and visualize the ebb and flow of water over the past 18 years.
Depletion is not necessarily a bad thing, of course. It is common for landscapes to store water during the rainy season, and dry out before the rains come again. The ecology of a region is adapted to this natural water cycle. A problem only arises when that cycle breaks. Perhaps the summers become too hot, or the rains come less often.
Changes like these are becoming more common as global climate cycles are disrupted by anthropogenic influence. In order to help understand these how our influence is affecting the regional water cycles, Esri built the Water Balance App […]
Full article: Change in Storage Maps added to the Living Atlas
More about the water cycle:
Figuring out the water cycle… still
Severe Global Water Cycle Shifts Due to Abrupt Climate Change
How large-scale water cycles influence earthquakes in California
We can see how humans have altered Earth’s water resources
Water shortages can destroy cultures: Interplay between society and hydrological effects
Chief Arvol Looking Horse’s Message on Water
Here Comes the Sea: The Struggle to Keep the Ocean out of California’s Coastal Aquifers