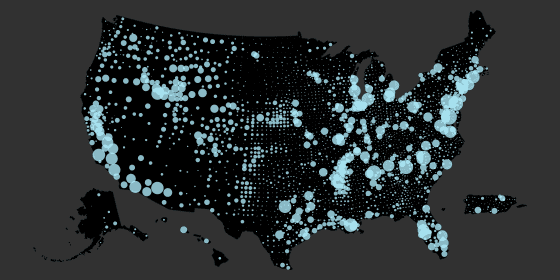
Although thermoelectric and irrigation are the dominant categories nationally, the county breakdown reveals regional variation. In the map below, you can see all categories for each county at once.
While you can still see that irrigation and thermoelectric are the largest, there is a striking contrast between the East — where thermoelectric is dominant — and the West — where irrigation is dominant.
As a result of all these spatial differences in how we use water, total water use differs greatly among states. Can you guess where these three states rank in total water use?
Data Collection
Every 5 years since 1950, the USGS has compiled and estimated water-use information in cooperation with State, Federal, and local agencies to document how and where we use water. This information is essential to understand how future water demands will be met, while maintaining adequate water quality and quantities for human and ecosystem needs. The fourteenth report in this series, Estimated use of water in the United States in 2015, was released in June of 2018, along with the county-level data which supports the publication.
References Dieter, C.A., Maupin, M.A., Caldwell, R.R., Harris, M.A., Ivahnenko, T.I., Lovelace, J.K., Barber, N.L., and […]
Full article: Water use in the U.S., 2015
More about various types of water use:
Strengthening policy innovation for water use in agriculture
Strengthening policy innovation for water use in agriculture
U.S.A. Household Water Use Continues to Decline
Watershed Planning Program (WPP) — Massachusetts