
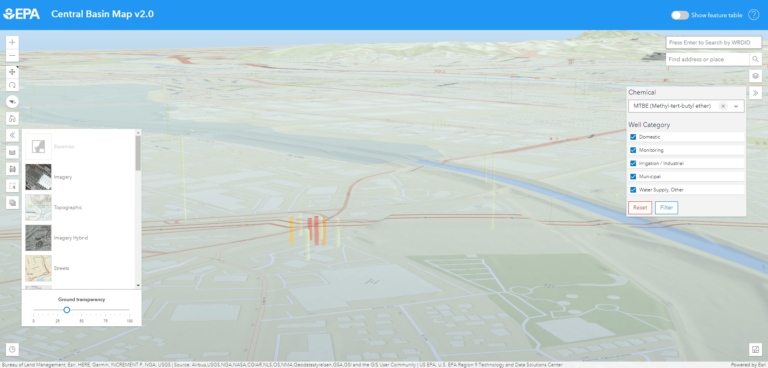
Map: A 3D view with basemap transparency adjusted to show underground wells, with filtering by chemical and the category of well.
A whopping 191 billion gallons of water are provided annually by the Los Angeles Department of Water and Power (LADWP) to meet the needs of Los Angeles County’s approximately 10 million residents—with more than one-third of that water coming from aquifers.
The bad news for these aquifers—and in turn for county residents—is that groundwater is vulnerable to a number of contaminants that can be introduced by processes like oil production or improper disposal of industrial waste. Water can become polluted with salts, chemicals, residual hydrocarbons, and toxic solvents like Trichloroethylene (TCE), which can potentially affect soil and groundwater quality. The LADWP monitors its water supply for more than 200 different contaminants throughout the year, including industrial discharges, residential and commercial wastewater, pesticides, stormwater runoff, and vehicle emissions.
The danger posed by these pollutants to the county’s water supply means that it is also monitored by organizations like the United States Environmental Protection Agency (EPA), which uses GIS technology to obtain data about well contamination in LA County. With 3D visualization, for instance, the EPA can make targeted regulatory actions based on a broad swath of data.
In 2023, with the assistance of Innovate! Inc., a consulting company that specializes in IT and GIS solutions, the agency released its 3D Well Data Explorer version 2. Based on Esri’s ArcGIS API for JavaScript, and developed with ArcGIS Pro, ArcGIS Online, and ArcGIS API for Python, the new iteration of the Well Data Explorer includes features that make it easier than ever for the EPA to understand and respond to groundwater contamination in LA County and beyond.
Updating the Software
“We evaluated the capabilities of the EPA’s new Well Data Explorer in the Los Angeles Central Basin for a number of reasons,” said Frank Roberts, geospatial subject matter expert at Innovate! Inc. “The population in the area is dense, there is a high residential/industrial mix, and there are a number of Superfund sites located in Los Angeles County.”

A Superfund site is any land in the United States that has been contaminated by hazardous waste and identified by the EPA as a National Priorities List (NPL) site because it poses a risk to human health or the environment. Southern California is currently home to nearly 20 NPL sites, which pose an inherent risk to the state’s population.
The EPA began the development of the database for the new 3D Well Data Explorer by acquiring data from the California State Water Resources Control Board’s Water Boards Groundwater Ambient Monitoring and Assessment (GAMA) program. GAMA integrates groundwater data from multiple sources to produce an inclusive table of analytical data. It maintains more than 6.1 million records for LA County.
“Since the GAMA database comes from a large number of contributors and covers a broad time range, there is significant variability within it,” said Roberts.
To incorporate that variability into software that could usefully analyze contamination data, Innovate! staff developed Python (ArcPy) scripts that allowed for data standardization. The dataset is then hosted in ArcGIS Online for use in the Well Data Explorer, and updated using Model Builder in ArcGIS Pro. In addition, the Slice Widget is used to reveal underlying 3D well data by slicing into an aquifer to expose the wells and determine which of them are contaminated. The EPA and California’s Department of Toxic Substances Control also use this dataset for other research.
A Tool for More Targeted Remedies
“The 3D Well Data Explorer allows us to determine how deep contamination has permeated into the wells and the amount of contaminant contained within them,” said Roberts.
This is useful not only because it allows the EPA to have a clearer picture of the location and extent of potential contamination, but also its causes and cumulative effects over time. This capability is reflected in some of the most effective updates to the Well Data Explorer.
“By including a time slider, we can visualize the accumulated concentration of […]
Full article: www.esri.com