How many people have access to clean and safe water? Where do they get it from, and how much do they pay for it? A new report by the World Health Organisation/Unicef Joint Monitoring Programme delves into data on drinking water from the last 17 years to give a detailed view of the state of access to drinking water today.
The report also examines how the current situation matches up to the vision for universal and equitable access to safe and affordable drinking water – set out by the sustainable development goals (SDGs). It considers gaps in the data and what we still need to know to achieve universal access.
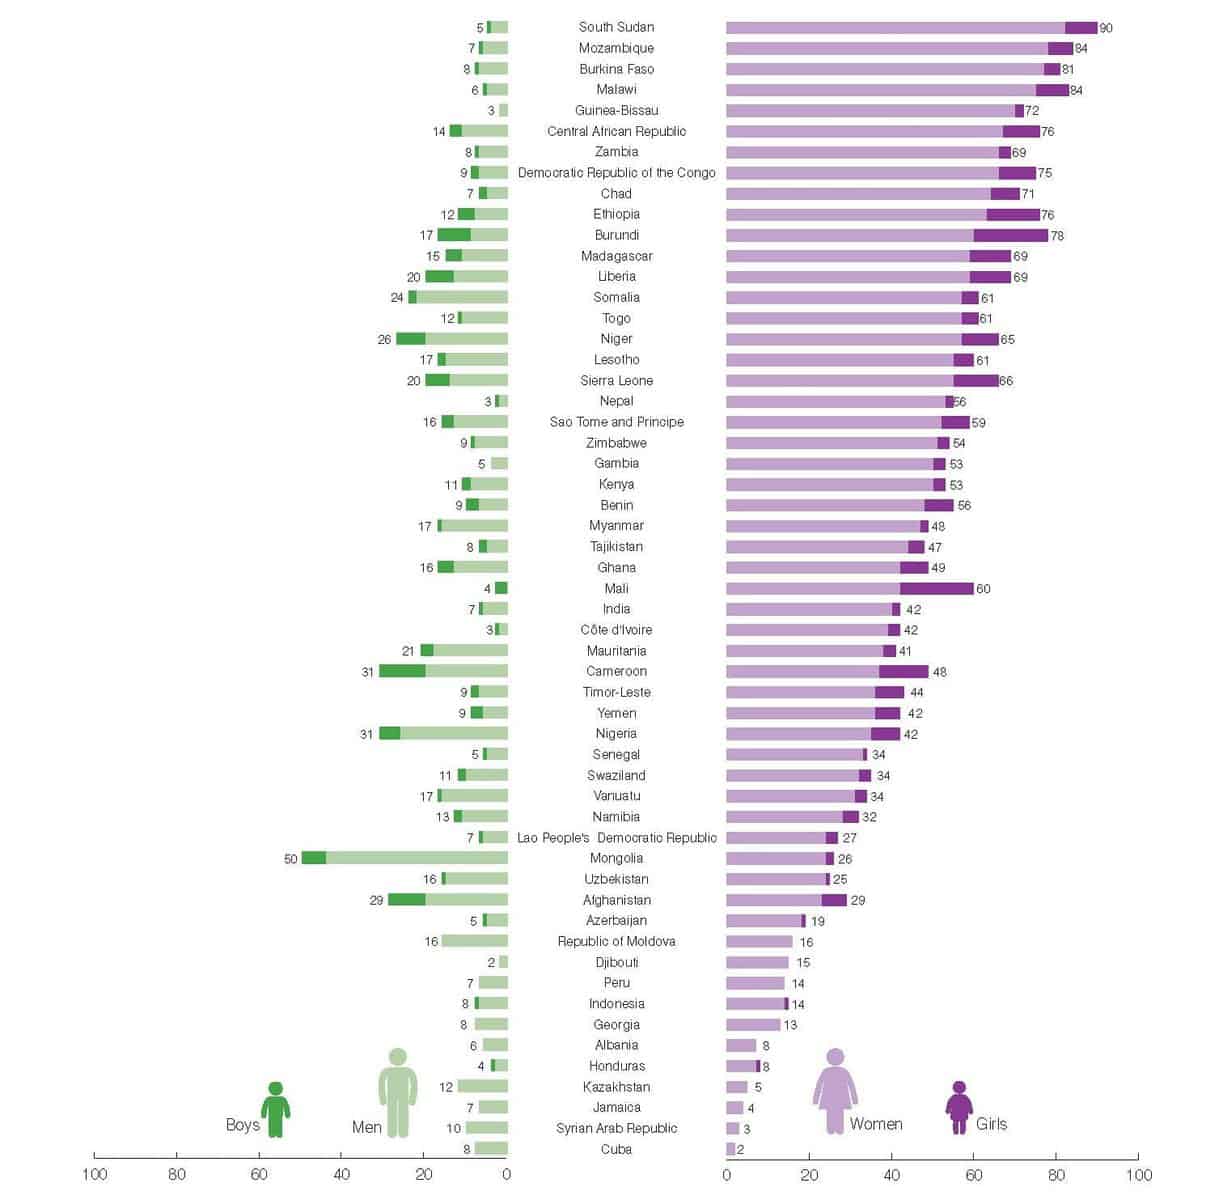
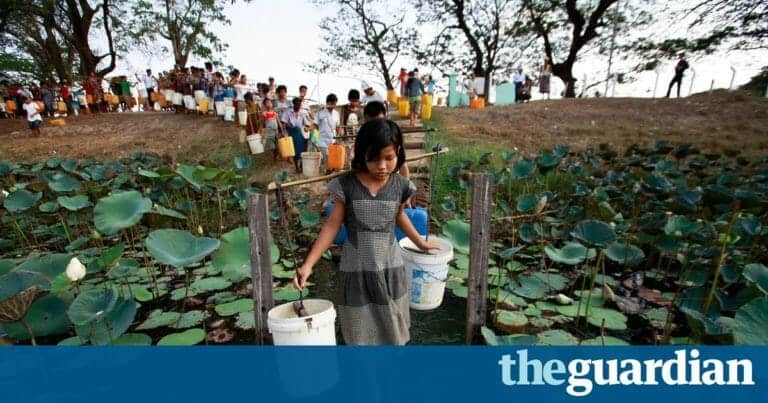
Billions of people have gained access to water, but huge inequalities remain Since 1990, 2.6 billion people have gained access to an “improved” drinking water source, one that is designed to protect against contamination. But in 2015, 663 million people – one in 10 – still drank water from unprotected sources. Huge inequalities persist between and within countries; almost half of people drinking water from unprotected sources live in sub-Saharan Africa, eight in 10 live in rural areas, and there are large gaps between the richest and […]
See the full article by Tom Slaymaker and Robert Bain, and all the infographics: Access to drinking water around the world – in five infographics