Photo credit: California Department of Water Resources
Earlier this month, I was working my way through my morning emails and discovered a brief note from one of my Interagency Ecological Program (IEP) colleagues. They had been notified by one of their field crew employees of some higher-than-normal chlorophyll concentrations in their routine water samples from San Pablo Bay (chlorophyll-a is a green plant pigment used to track the presence of phytoplankton in our aquatic systems). These higher-than-normal chlorophyll levels can be associated with harmful algal blooms (HABs) that produce toxins that are dangerous to humans, pets, and fish. HABs were a potential cause of a Bay-Delta Estuary fish kill in Lake Merritt last August. A toxic red tide killed up to 10,000 fish, according to a variety of organizations, including the California Department of Fish and Wildlife.
Ever curious, my colleague quickly searched the internet for ambient water quality status and viewed online the increasingly available data associated with monitoring California’s San Francisco Estuary. This was not something that was easy to do as recently as a year ago, and certainly not five years ago. My Delta Science Program colleague Tricia Lee (who is the point person for nutrient, contaminant, and HAB issues) and I watched with interest as the Bay-Delta stakeholder community rapidly became aware of the more recent water quality “incident,” and began communicating together to track its progress in the Estuary. We were excited to see how increasing public access to water quality information in the Estuary has improved detection, notification, and information sharing regarding the ongoing ecological status in the Bay-Delta system. This is especially fortunate and illustrative since Tricia is currently leading an effort at the Delta Science Program to provide a strategy for improving HAB monitoring even as we work to reliably forecast specific phytoplankton blooms and predict when and where HABs will occur. In a companion blog, Tricia discusses current efforts to create a more cohesive HABs monitoring strategy.
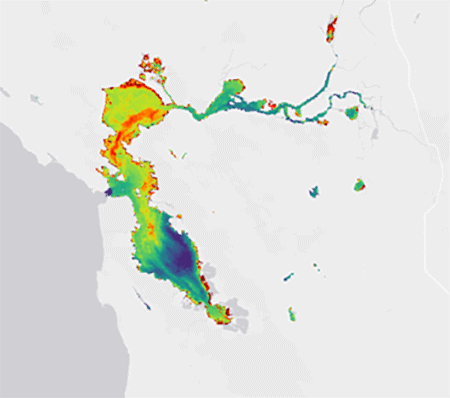
This map is a screenshot of some newly available information (chlorophyll-a data from the San Francisco Estuary Institute [SFEI]) that helped fuel recent conversations about this month’s phytoplankton bloom. The map colors display relative concentrations of chlorophyll-a from low to high, with blue indicating lower levels and red showing higher levels. In this case, a “bloom” is defined as the presence of an area of the Estuary with higher chlorophyll-a concentrations than surrounding areas, or with higher-than-normal background levels of chlorophyll-a compared with a given time of year. While the SFEI HAB satellite tool is still in “beta,” the information displayed prompted several of our colleagues to begin communicating to a broad stakeholder audience regarding the burgeoning event. We tracked several communications via Twitter (or X) indicating that organizations like The Baykeeper and the IEP were ramping up efforts to follow the event and inform the public about its progression, and potentially, any impacts. There was also communication that any observations of potential fish kills could be rapidly reported and recorded via a recently created page at iNaturalist. We support these efforts and suggest that increased underwriting of and funding for similar communication tools regarding such environmental events is in the best interest of those researching and managing State environmental resources on behalf of our local, regional, and statewide communities.
The number of web sites collecting and displaying environmental and water quality data about our Estuary is expanding rapidly. This is a powerful development in our ability to communicate more clearly and quickly changes we see in the environment in which we live. You can follow the daily chlorophyll concentrations, and thereby the HAB, in the Estuary on fhab.sfei.org, which includes a “Cyano index” layer that shows if any blooms are being caused by cyanobacteria specifically. Additional examples for viewing water quality data include […]
Full article: deltacouncil.ca.gov
Coral reefs already face a litany of threats. Experts say storm runoff from the recent…
https://www.youtube.com/watch?v=0Xqa0B9r7Y8 Iowa water: Pulitzer Prize winner Art Cullen and award-winning cinematographer Jerry Risius have teamed…
Clean water is essential for life, yet millions of Americans unknowingly consume contaminants through their…
Human brains contain higher concentrations of microplastics than other organs, according to a new study, and the…
From the Office of the Governor: In anticipation of a multi-day, significant atmospheric river in Northern California,…
From Governor Newsom: Scientists, water managers, state leaders, and experts throughout the state are calling…