Our last post gave you an introduction to the water weeds of the Delta. Invasive submerged aquatic vegetation is taking over the waterways, making it difficult for boaters, fish, water project operations, and scientific researchers (Khanna et al. 2019). As we described in the blog “Getting into the weeds”, they are hard to control too. But how do we collect data on aquatic weeds and what do those data look like?
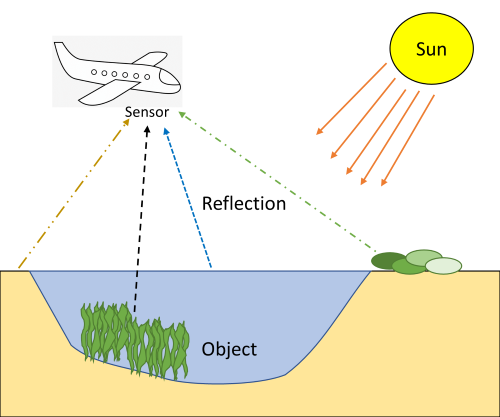
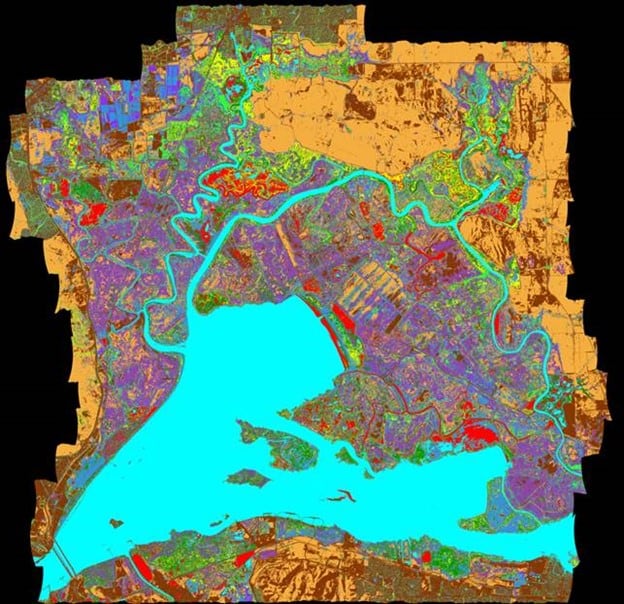
There are two main types of data that we can work with (see IEP Technical Report 92 (PDF) for details). The first, is collected with areal photographs, and is known as ‘remote sensing’ (Figure 1). A specialized camera (sensor) is mounted on a platform (a drone, airplane, or satellite), and it can collect a regular-old photograph, or a hyperspectral photograph that records a lot of wavelengths of light that our eyes can’t see. Because different types of plants reflect different spectra of light (they are different colors) these photographs can be used to map location and extent of vegetation (Figure 2).
The UC Davis Center for Spatial Technologies and Remote Sensing (CSTARS) has been mapping vegetation in the Delta using hyperspectral imagery collected with airplanes for most of the last 20 years (like the map in Figure 2). They create maps every year and share their data online via the Knowledge Network for Biocomplexity.
Hyperspectral imagery is very good for identifying floating aquatic vegetation and terrestrial vegetation, but the water makes it hard to identify submersed vegetation. We can map where submersed vegetation is, but not what kind of vegetation is there. To look at community composition, we need to […]
Full article: iep.ca.gov
Coral reefs already face a litany of threats. Experts say storm runoff from the recent…
https://www.youtube.com/watch?v=0Xqa0B9r7Y8 Iowa water: Pulitzer Prize winner Art Cullen and award-winning cinematographer Jerry Risius have teamed…
Clean water is essential for life, yet millions of Americans unknowingly consume contaminants through their…
Human brains contain higher concentrations of microplastics than other organs, according to a new study, and the…
From the Office of the Governor: In anticipation of a multi-day, significant atmospheric river in Northern California,…
From Governor Newsom: Scientists, water managers, state leaders, and experts throughout the state are calling…