Photo © iStockphoto.com/iofoto
February 22, 2019 — As climate change, urban development, irrigation and other factors are altering the availability of water, it’s important to understand how we use water on a daily basis in the U.S. — and where the opportunities are for using it more wisely.
A recent report from the U.S. Geological Survey (USGS) provides an overview of water withdrawals across the country.
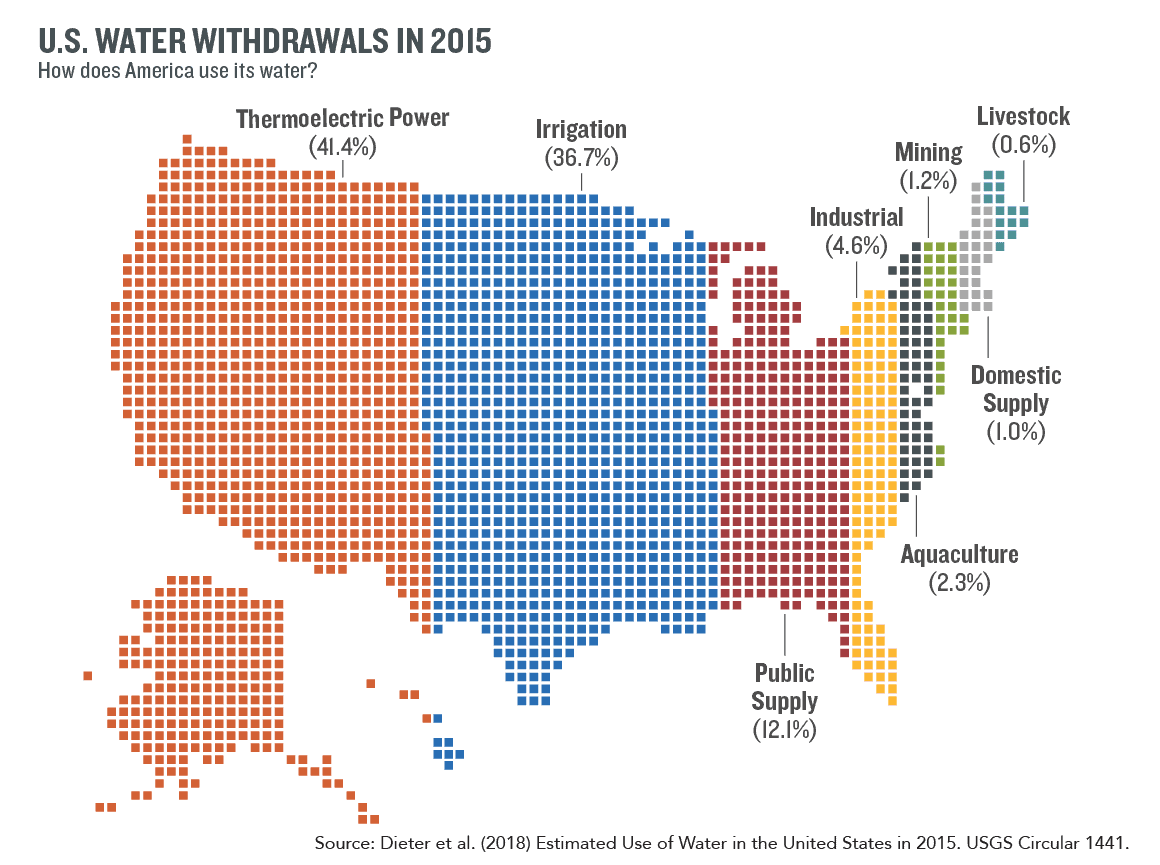
The report includes a few surprises. For example, did you know Idaho withdraws the most water nationwide for aquaculture? That Arkansas — the 33rd most-populous state — withdraws the fifth most water, mainly for crop irrigation? Or that power plants are the largest users of water in the country?
The following maps and data visualizations paint a picture of how and where America uses its water.
According to the USGS, freshwater and saline water (seawater and brackish coastal water) withdrawals in the in the U.S. in 2015 totaled approximately 322 billion gallons (1.22 trillion liters) per day — 9 percent less than in 2010. This decline occurred even as the U.S. population increased 4 percent. As the map below shows, thermoelectric power generation and irrigation were the dominant uses of this water.
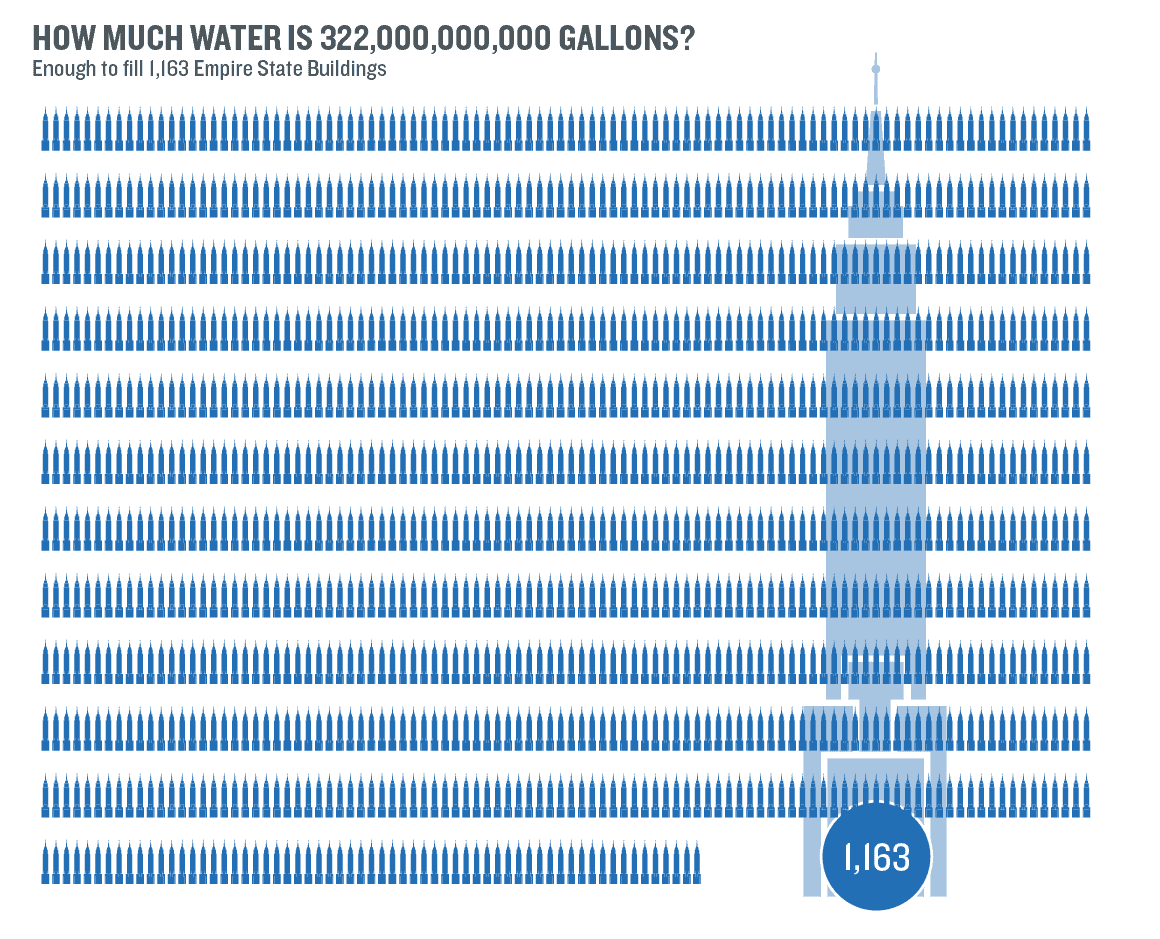
The U.S. used 322 billion gallons of water per day in 2015. That’s a really big number. But how big is it?
On a typical day in the U.S. we withdraw enough water to fill 1,163 […]
Full article: America uses 322 billion gallons of water each day. Here’s where it goes.
Chris Wood, President and CEO of Trout Unlimited, speaks to staff from Trout Unlimited, NOAA…
Photo Credit: iStock The lake supports nearly 300 species of birds, mammals, and fish, as…
Map: A 3D view with basemap transparency adjusted to show underground wells, with filtering by…
As part of SF Climate Week, KQED’s Danielle Venton sat down with the California Secretary…
JT Chevallier and JB Harris operate BEBOT during a demo on Tallac Beach, June 15,…
The Biden administration announced new protections for millions of acres of wetlands, which are essential…